A data-driven approach to meeting business objectives.
Organizations capture and calculate hundreds of metrics, and spend thousands of hours producing reports that serve only to confuse, overwhelm, and paralyze the decision making process. The following guidelines were created to help businesses identify the metrics that matter, ensure they’re linked to business needs, and produce reporting that drives action.
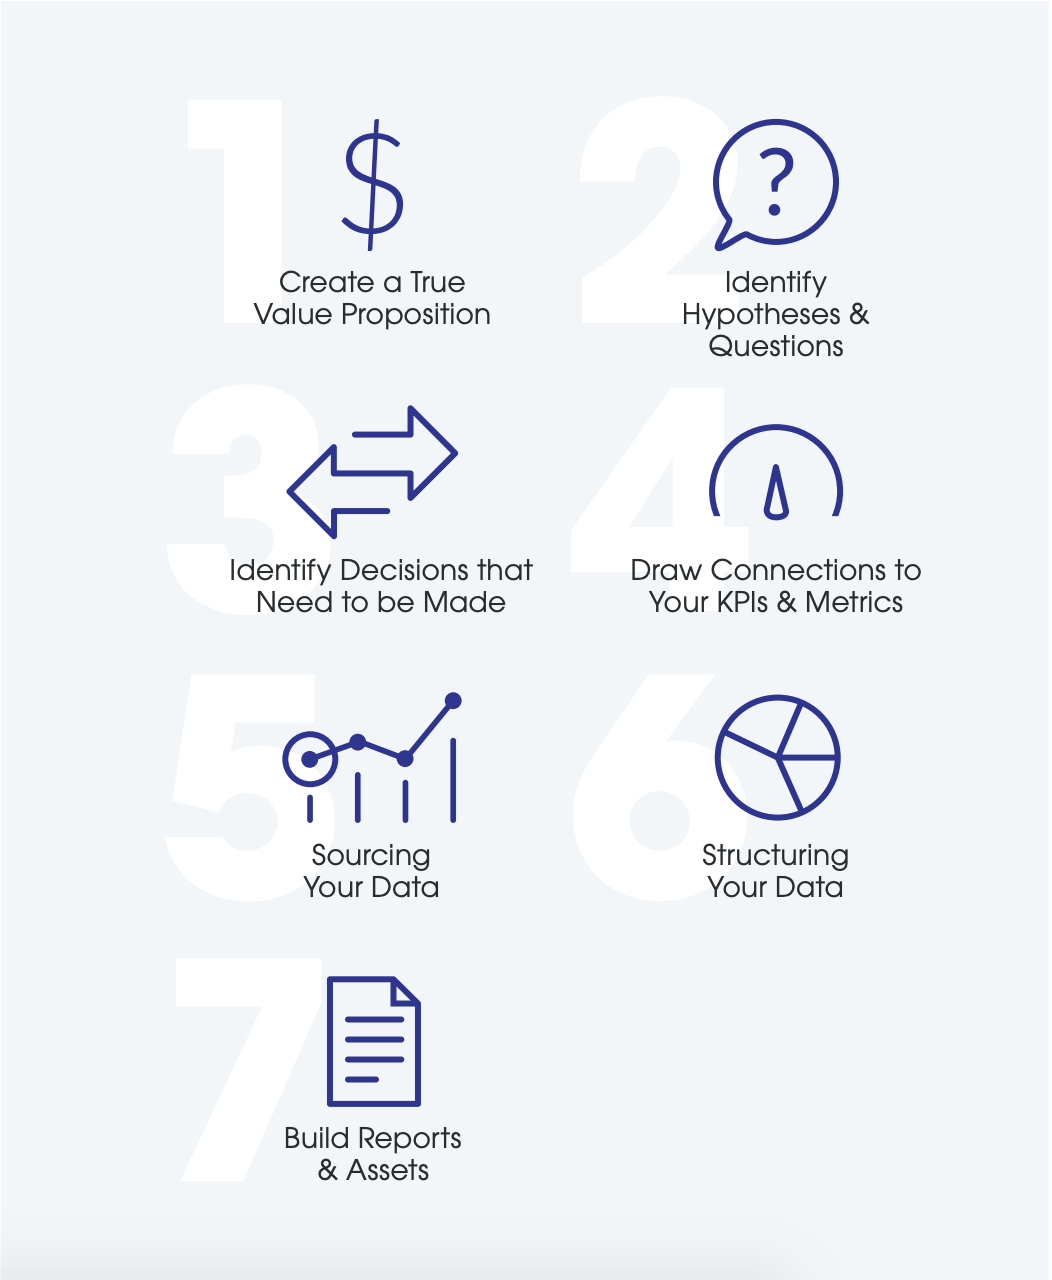
Step 1: Create a True Value Proposition
This isn’t the loose, marketing-speak value proposition that would go into a slide presentation. At its core, it’s simply why your customers would choose you – why they’d buy your product, subscribe to your service, or even use a feature on your website. Take the time to develop more than a superficial understanding of this, otherwise, everything else in the framework will suffer.
Step 2: Identify Hypotheses & Questions
Nothing ever gets built with perfect, complete knowledge. You probably needed to make some assumptions and predictions about your value proposition that allowed you to proceed to Step 2. Identify them so they can be validated or rejected and you don’t continue to make decisions based on inaccurate assumptions.
Step 3: Identify Decisions that Need to be Made
If you’ve ever looked at a report or analysis and thought, “What am I supposed to take from this?”, there’s a good chance this step was omitted. Step 3 is the “Why?” to support Step 2’s “What?”
Also, be aware that there may be decisions that aren’t connected to Step 2 that you need to include here – bigger strategic decisions like mothballing a product, pivoting away from a customer segment, or making adjustments to a product/service price. As a way to box these, try to think of them as decisions for now (within 30 days), next (60 days), and later (90+ days).
Step 4: Draw Connections to Your KPIs & Metrics
This step is critical because it ties together the previous three steps and starts to pivot into facts. It's also, unfortunately, where people often start the process of “measurement.” Resist this urge and your patience and discipline will be rewarded.
Creating solid, documented linkages between the previous steps and specific metrics is a strong way to ensure that rogue metrics don’t sneak into your work. As a starting point, ask a business analyst for their favorite requirements documentation template or process.
Step 5: Sourcing Your Data
If you haven't made friends with a data architect or business analyst, now’s the time to do it. You’re going to need some help finding all the systems, tables, and sources for the data that’s required to create those KPIs. Given that most businesses have poor documentation, this could require some detective work.
Still, finding the source is only half the battle. Organizations need to evaluate it and see if it’s the right data to answer the business question and impact decisions.
Step 6: Structuring Your Data
When you combine multiple data sources, opportunities for data to be duplicated or mislabeled inevitably arise. And if your organization is like most others, it's unlikely your data is so clean and orderly that you can write a quick query, drop the data you need into your favorite visualization tool, and start cranking out reports and analysis. Enter data structuring – the process of cleaning, formatting, organizing, and preparing your data to be used for analysis.
Partnering with your new friend the data architect is a great way to ensure you can bring all the disparate data together, transformed and aggregated as necessary, ready for developers to work with quickly.
Step 7: Build Reports & Assets
Build out sample reports and mock-ups and share them with stakeholders to review and iterate from. Despite all the work in previous steps, there will still be iterations needed in this phase, but they should be manageable and related to interpretation, not the fundamentals. And even though reporting/metrics are often the deliverables, this process applies to model development, analysis, segmentation, or any activity that’s data-driven.
Check out the full white paper to learn the key questions you should be asking during each step.
Share this Blog with colleagues